NRL 2016 predictive model results to date (r05)
maxwellAI
4 April 2016
Introduction
This post is to summarize the 2016 results to date (round 05) and compare this to the bookmakers predictions. Considering that round 6 is now going to be my first betting round (in lui of round 5 - purely due to the minimal time I have had to work on this), I thought it important to track how we are going to date. I am also going to discuss the results of a model re-run since the results of round 4 and 5 were less than favorable.
Summary of results to date (r05)
We observe from the summary table/s and figures below that:
overall model accuracy/precision to date is 56%
overall bookmaker accuracy/precision to date is 66%
the model had higher accuracy than the bookmakers in rounds 2 and 3
the models round 4 and 5 accuracy was below 50%
Bookmaker precision was very poor (<30%) in round 3
In round 5, there were 6 away team wins vs 2 home team wins
In round 4 there were and even number of home and away team wins (4 home and 4 away)
In all other rounds the number of home team wins outweighed the number of away team wins
poor accuracy in round 4 is largely attributed to predictions being based on round 2 results (without knowing round 3 results) and high away team wins (4)
poor accuracy in round’s 5 is largely attributed to high number of away team wins (6)
round 3 contained a drawn match which is historically rare (there have only been 8 drawn games since the inception of the golden point rule representing 0.5% of all games to date)
Results to date (r05)
Given:
mTP = Models true positives
mFP = Models False positives
mPrec = Models precision (equivalent to accuracy in this case)
bTP = Bookmakers true positives
bFP = Bookmakers False positives
bPrec = Bookmakers precision (equivalent to accuracy in this case)
Table of results
| round_no | season | mTP | mFP | bTP | bFP | mPrec | bPrec |
|---|---|---|---|---|---|---|---|
| 1 | 2016 | 5 | 3 | 5 | 3 | 0.625 | 0.625 |
| 2 | 2016 | 7 | 1 | 6 | 2 | 0.875 | 0.750 |
| 3 | 2016 | 4 | 3 | 2 | 5 | 0.571 | 0.286 |
| 4 | 2016 | 3 | 5 | 7 | 1 | 0.375 | 0.875 |
| 5 | 2016 | 3 | 5 | 6 | 2 | 0.375 | 0.750 |
Models average precision
## [1] 0.564Bookmakers average precision
## [1] 0.657Plots of results


Discussion of results
We can see from the results that the model performed particularly poorly through rounds 4 and 5 as compared to the bookmaker. This dramatically affected overall precision which was 56% as compared to the bookmakers 66%. After reviewing the model, I determined that the main reason for poor performance through rounds 4 and 5 is due to the high weight of the importance of feature ‘home_away’ in the model. Because the model (in most circumstances) preferentially picks home teams to win, the model suffered from a dramatic increase in away teams winning through rounds 4-5.
We also observe poor accuracy from the bookmaker in round 3 where there were a number of very close games, and a draw. As the model was likely ignoring additional feature the bookmaker was relying on in round 3 (and using home/away as a highly weighted feature) the model performed well by comparison.
Generally, I would have expected model accuracy to be increasing as rounds progress (based on historic analysis), however the importance of home/away in the model was such that it overwhelmed the importance of other features such as summary of results to date, previous match ups etc. Re-running the model with less weight (less feature importance) on home/away confirms that accuracy would be higher by boosting the importance of other features. We have seen that in 2015, the importance of home away teams was much lower than historic (2009-2014) and 2016 may turn out to be similar in this regard.
Re-modelling
Since I didn’t get an opportunity to use round 3 results for round 4 predictions I firstly wanted to re-model this to determine if round 4 accuracy would have been improved. Secondly, because I am generally not satisfied with the average precision to date, and the degradation in precision (we should actually be improving in precision) I wanted to re-model all rounds with an improved predicative model. Specifically, I am concerned that the original model/s place too much significance on the home/away feature and that (like in 2015) we may see reduced significance of this feature in 2016. Therefore I chose to ‘de-weight’ this feature so that it was not an overwhelming predictive feature in the model/s. As you will see, the new model improved average precision to date, generally improved precision across all rounds as compared to the current model, and had slightly better overall precision than the bookmaker
Re-modeling of round 4 results
As stated; round 4 predictions were based of results to round 2. I re-ran the model to include round 3 results, however predictions were the same. I expected the predictions to be different due to the inclusion of round 3 results, however the weight of the home and away feature at this early stage in the model actually mitigated the weight of previous win/loss results. This largely drove low predictive accuracy in rounds 4 and 5.
Re-modelling of all rounds
Re modelling of all rounds shows an overall increase of precision from 56.4% to 67.5% which is slightly higher than the bookmakers overall precision 65.7%. As stated the re-modelling places less weight on the home/away feature and hence mitigates the dramatic decrease in accuracy across rounds 4 and 5. In fact as show below, the precision of the new model is similar in shape to the bookmakers and actually did slightly better in round 3.


Financial modelling
Finally, I wanted to determine how we would have went using various staking strategies to bet on predictions to date. As stated previously one of the main reasons for choosing to wait until round 5 or 6 to place bets was due to historically poor (50-60%) model performance in rounds 1-5. So it is worth finding out if we would have lost money betting in these rounds this year. I was also interested to know if my preferred staking strategy would have mitigated losses (avoided losing bets). i am going to keep it relatively simple and just compare a fixed staking strategy to my preferred staking strategy.
Fixed staking
First up lets have a look at a simple fixed staking strategy. We will use $10 as a fixed bet, and see what happens if we place $10 on every game which we predicted to win. To do this, we simply use the rule that if mTP = 1 then profit equals bookmakers odds * 10, and if (conversely) mFP = 1 then loss = 10.
If we chart this up we see that the cumulative loss to date would have been $49.40.
We can see in the chart split by round that we would have had a steady increase in profit after game 12 through 18 and then had rapid decline through rounds 4 and 5 (due to the poor predictive accuracy in these rounds)


Fixed staking with proability cut-off
Now lets look at what we would have ended up with if we used the proposed Staking Strategy and only bet on those games in which the models perceived probability is greater than the bookmakers implied probability and on the condition that the perceived probability is greater than the average of the models false positive perceived probability (FPpp). For reference in this case the FPpp threshold was ~0.67.
If we do this, unfortunately, the number of games which satisfied the condition are limited (7 out of 40 games), which means the cumulative profit was static (stayed the same) across many games. This can be observed in the below chart. In addition, we can see that we make steady cumulative profit from the first 3 bets (in round 5, 8 and 15) which is wiped out by a single loss.We see the same pattern from game 23 where we make small profit right up until game 40 (picked bulldogs to win against Canberra) on which we lost, wiping out all profit. In the end this staking strategy lost $0.40 (essentially broke even). It has highlighted a key issue with this strategy which I discussed in Bookmaker Analysis; that is, because we are betting on games which are short odds, our profit from bets is small, and single losses dramatically affect the total profit.
To put it another way, using this strategy we actually won on 5 of 7 bets (71% staking accuracy) but just two losses were enough to reduce the to essentially 0!

Finacial modelling of new model
Finally, knowing that our originally model predictions (as posted) would not have achieved profit using a fixed staking method, and would have only broke even using the proposed staking strategy, lets take a look at how the improved model would have fared..
We can see from the graphs below that the both the fixed staking and the probability cut-off (preferred) staking methods yielded profit with the new model. In fact the preferred staking method did not suffer a single loss (staking accuracy of 100%) and had a return on investment (ROI) of 26%. We can also see that the number of bets was small (again 7 out of 40 available) and through rounds 3 and the 4, a very limited number of bets were recommended (mitigating poor round 3 results in the new model).
Despite this; the fixed stake method yielded higher profit simply because the accuracy of the new model was higher than the bookmaker, and hence benefited from long odds bets.


Conclusion
I have shown that my strategy to wait until round 6 to make a bet was a good choice, as the original model suffered from low overall accuracy (56% to date). Despite this I have also shown that my preferred staking strategy had high accuracy (71%) and was able to mitigate most losses, however would have only broke even in terms of profit. I have also shown that my latest model would have produced much better results through rounds 1-5 (67.5% accuracy) and we would have made a profit no matter which staking strategy used. I am going to utilize the latest model for round 6 predictions and at this stage, I will utilize the risk adverse preferred staking strategy.
Appendix - Summary of all predictions to date
| round_no | game_no | tip_text | result | |
|---|---|---|---|---|
| 2810 | 1 | 1 | Brisbane Broncos to win against Parramatta Eels while Away | Correctly picked |
| 2811 | 1 | 2 | Manly Sea Eagles to win against Canterbury Bulldogs while Home | Incorreclty picked |
| 2813 | 1 | 3 | Canberra Raiders to win against Penrith Panthers while Home | Correctly picked |
| 2816 | 1 | 4 | New Zealand Warriors to win against Wests Tigers while Away | Incorreclty picked |
| 2817 | 1 | 5 | North Queensland Cowboys to win against Cronulla Sharks while Home | Correctly picked |
| 2820 | 1 | 6 | South Sydney Rabbitohs to win against Sydney Roosters while Away | Correctly picked |
| 2822 | 1 | 7 | Newcastle Knights to win against Gold Coast Titans while Away | Incorreclty picked |
| 2823 | 1 | 8 | Melbourne Storm to win against St George Illawarra Dragons while Home | Correctly picked |
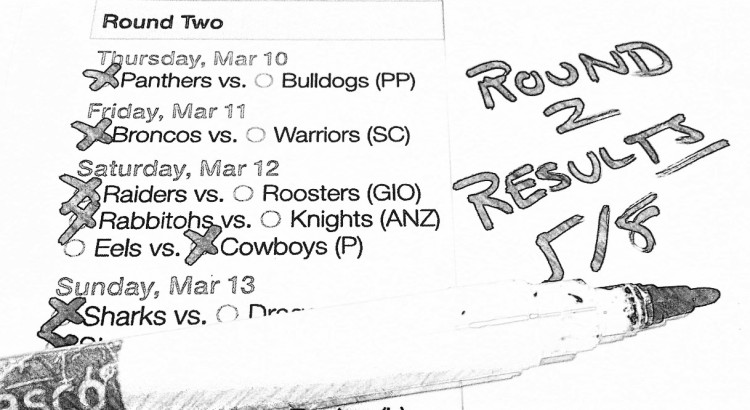
| 2825 | 2 | 1 | Penrith Panthers to win against Canterbury Bulldogs while Home | Incorreclty picked |
| 2827 | 2 | 2 | Brisbane Broncos to win against New Zealand Warriors while Home | Correctly picked |
| 2829 | 2 | 3 | Canberra Raiders to win against Sydney Roosters while Home | Correctly picked |
| 2831 | 2 | 4 | South Sydney Rabbitohs to win against Newcastle Knights while Home | Correctly picked |
| 2833 | 2 | 5 | Parramatta Eels to win against North Queensland Cowboys while Home | Correctly picked |
| 2835 | 2 | 6 | Cronulla Sharks to win against St George Illawarra Dragons while Home | Correctly picked |
| 2837 | 2 | 7 | Melbourne Storm to win against Gold Coast Titans while Home | Correctly picked |
| 2839 | 2 | 8 | Wests Tigers to win against Manly Sea Eagles while Home | Correctly picked |
| 2841 | 3 | 1 | North Queensland Cowboys to win against Sydney Roosters while Home | Correctly picked |
| 2843 | 3 | 2 | Canterbury Bulldogs to win against Parramatta Eels while Home | Incorreclty picked |
| 2845 | 3 | 3 | Newcastle Knights to win against Canberra Raiders while Home | Incorreclty picked |
| 2848 | 3 | 4 | Brisbane Broncos to win against Penrith Panthers while Away | Incorreclty picked |
| 2849 | 3 | 5 | Gold Coast Titans to win against Wests Tigers while Home | Correctly picked |
| 2852 | 3 | 6 | Melbourne Storm to win against New Zealand Warriors while Away | Correctly picked |
| 2854 | 3 | 7 | South Sydney Rabbitohs to win against St George Illawarra Dragons while Away | Incorreclty picked |
| 2855 | 3 | 8 | Manly Sea Eagles to win against Cronulla Sharks while Home | Correctly picked |
| 2857 | 4 | 1 | South Sydney Rabbitohs to win against Canterbury Bulldogs while Home | Incorreclty picked |
| 2859 | 4 | 2 | Brisbane Broncos to win against North Queensland Cowboys while Home | Correctly picked |
| 2861 | 4 | 3 | Canberra Raiders to win against Gold Coast Titans while Home | Incorreclty picked |
| 2863 | 4 | 4 | Sydney Roosters to win against Manly Sea Eagles while Home | Incorreclty picked |
| 2865 | 4 | 5 | St George Illawarra Dragons to win against Penrith Panthers while Home | Correctly picked |
| 2867 | 4 | 6 | New Zealand Warriors to win against Newcastle Knights while Home | Correctly picked |
| 2869 | 4 | 7 | Wests Tigers to win against Parramatta Eels while Home | Incorreclty picked |
| 2872 | 4 | 8 | Melbourne Storm to win against Cronulla Sharks while Away | Incorreclty picked |
| 2873 | 5 | 1 | Manly Sea Eagles to win against South Sydney Rabbitohs while Home | Incorreclty picked |
| 2876 | 5 | 2 | Brisbane Broncos to win against Gold Coast Titans while Away | Correctly picked |
| 2877 | 5 | 3 | Melbourne Storm to win against Newcastle Knights while Home | Correctly picked |
| 2879 | 5 | 4 | Wests Tigers to win against Cronulla Sharks while Home | Incorreclty picked |
| 2881 | 5 | 5 | North Queensland Cowboys to win against St George Illawarra Dragons while Home | Correctly picked |
| 2883 | 5 | 6 | Sydney Roosters to win against New Zealand Warriors while Home | Incorreclty picked |
| 2885 | 5 | 7 | Parramatta Eels to win against Penrith Panthers while Home | Incorreclty picked |
| 2887 | 5 | 8 | Canterbury Bulldogs to win against Canberra Raiders while Home | Incorreclty picked |